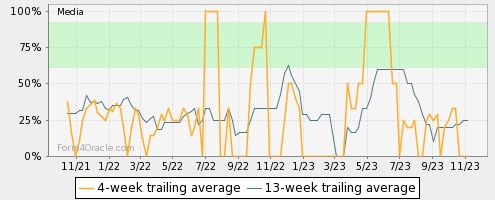
This chart shows the 1 and 3-month trailing buy ratios for all reporting companies
in this industry group over the last two years.
Insiders are known as the ultimate value investors, buying on weakness and
excessive corrections.
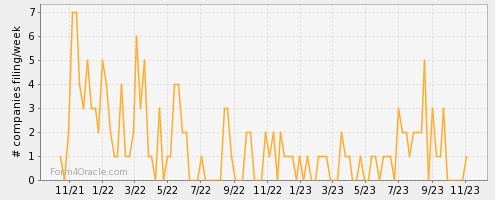
This chart shows the number of companies reporting filings each week in this industry
group. These numbers
are very cyclical in nature due to quarterly earnings reporting schedules and the
associated restrictions on insider trading dates.